How to Measure Forecast Accuracy: WMAPE, Bias, and the Metrics That Actually Matter
MAPE breaks on intermittent demand, accuracy without bias is misleading, and a headline number at the wrong grain tells you nothing. A practical guide to measuring forecasts you intend to act on.
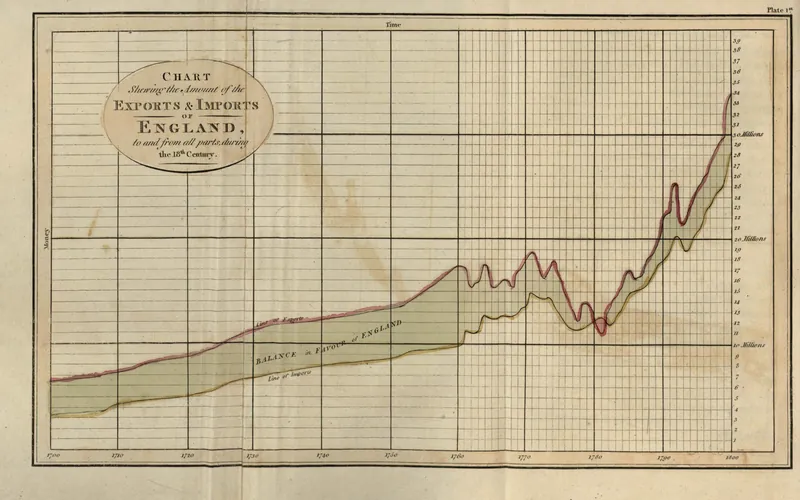
Chart shewing the amount of the exports & imports of England, The Commercial and Political Atlas · William Playfair, 1801 · Internet Archive · Public domain
On this page
"The forecast is 85% accurate" is one of the least informative sentences in planning. Accurate against what baseline, at what grain, over what horizon, and biased in which direction?
Here is a measurement setup that survives contact with a real planning process.
Start with the error metric
MAPE (mean absolute percentage error) divides by each actual, so it is undefined when an actual is zero and unstable when actuals are small. That makes it a poor standalone measure for intermittent SKU-location demand.
WMAPE (weighted MAPE) fixes this by dividing the sum of absolute errors by the sum of actuals:
WMAPE = Σ|actual − forecast| / Σ actual
This volume-weighted summary avoids dividing by each individual zero. It is still undefined when total actual demand is zero, and it can hide poor performance in low-volume segments, so treat it as one headline measure rather than a universal score.
Two useful companions:
- RMSE when large misses are disproportionately expensive — it penalises them quadratically.
- MASE when you want a scale-free comparison against a naive baseline; values below 1 mean you are beating the naive forecast.
Then measure bias separately
Accuracy and bias are different failures with different consequences.
Bias = Σ(forecast − actual) / Σ actual
A model can post a good WMAPE while running a persistent +8% bias, and that bias will quietly accumulate inventory every cycle. Report bias at every level you plan at — total, category, location, and horizon — because bias that nets to zero at the top is often two large opposing biases underneath.
Measure at the grain of the decision
Relative error often appears to improve as series are aggregated because opposing misses can offset one another. A chain-level weekly score therefore cannot stand in for a SKU × store × week score when replenishment happens per store.
Report at the grain where the decision is made. If an aggregate view is useful too, label it as a separate decision level.
| Grain | Typical WMAPE range | Used for |
|---|---|---|
| Total × month | Low | Finance, capacity |
| Category × week | Moderate | Buying, promotions |
| SKU × location × week | High | Replenishment, allocation |
The point is not the numbers — they vary enormously by business — it is that comparing a SKU-location forecast against a category-level benchmark is not a comparison at all.
Backtest with time respected
Random train/test splits are usually inappropriate for ordered forecasting data because they can let later observations influence evaluation of earlier periods. Use rolling-origin backtests: train to a cutoff, forecast forward over the full horizon, roll the cutoff, repeat.
Two rules make backtests honest:
- Report by horizon step. A model that is strong at week 1 and weak at week 4 is a very different tool from one that is even across the horizon — and if you plan four weeks out, the week-4 number is the one that matters.
- Use only information available at the cutoff. That includes late-arriving data: if actuals are restated a week later, your backtest must use the un-restated version.
Always carry a baseline
A useful accuracy report includes at least one naive baseline — such as the same period last year or a moving average of recent periods. It answers a practical question: does the model improve on a transparent alternative?
When a baseline is competitive, that is useful information rather than an embarrassment: it identifies where added model complexity may not be justified.
A reporting template that works
For each model run, publish:
- WMAPE and bias, at the decision grain, by horizon step
- The same two metrics for the naive baseline
- Bias by major segment (category, region, channel)
- Coverage notes: which SKU-locations were excluded and why
That is four short tables. It is enough for a planner to trust the number, and enough for an analyst to find the problem when trust breaks.
Sources and further reading
These references support the technical concepts discussed above. Examples and recommendations in the article remain editorial interpretation.