Margin Leakage: Finding the Profit You Already Earned
Margin rarely disappears in one place. It drains through discount authority, freight recovery, returns, and price-cost lag — each too small to notice on its own, together large enough to matter.
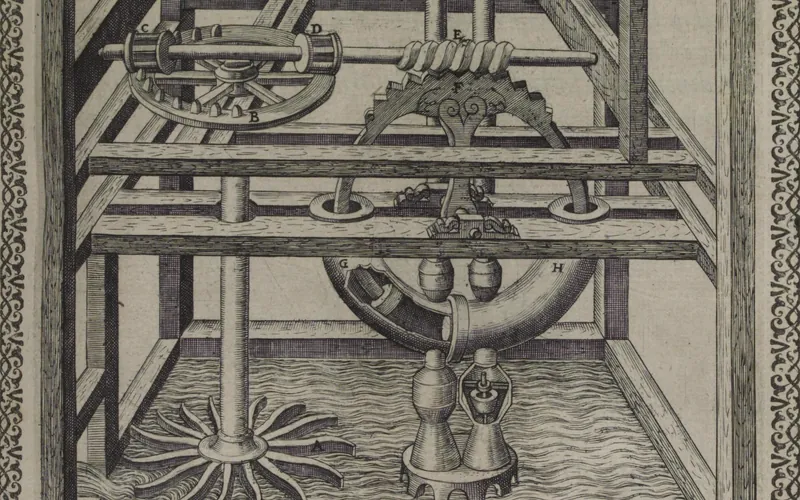
Figure XIII, water-raising pump, Le diverse et artificiose machine · Agostino Ramelli, 1588 · Library of Congress, Rosenwald Collection · Public domain (no known restrictions)
On this page
A monthly category-level gross-margin report can conceal transaction-level dispersion because gains and losses net out in aggregation. A diagnostic view therefore needs to preserve the grain at which prices, costs and service choices differ.
The usual suspects
Discount authority drift. Discretionary discounts can move from exceptions toward routine practice. A clustered or bimodal discount distribution by representative or branch may indicate a repeated concession and warrants review against the approved policy.
Freight and delivery recovery. Delivery cost may be charged at a standard rate while actual cost varies by distance, drop size and vehicle fill. Some orders can become negative-margin after fulfilment cost and remain hidden when freight is treated only as overhead.
Returns and re-work. When processing, restocking and disposal costs are booked centrally, line-level product margin can omit a material cost-to-serve component.
Price-cost lag. If input cost rises in March and list price updates in July, four months of volume ship under an older margin assumption. The size and timing of cost pass-through should be measured rather than presumed.
Rebate and allowance misalignment. Accrual assumptions can diverge from realised volume, leaving the recorded allowance inconsistent with the eventual rebate obligation.
How to actually find it
Leakage analysis works from a fully-costed transaction line: net price after all discounts, allowances and rebates, minus landed cost, minus attributable fulfilment and returns cost. Build that once and the analysis becomes straightforward.
Then look at dispersion, not averages:
| View | What it exposes |
|---|---|
| Realised margin % by transaction, plotted as a distribution | The negative tail, and how heavy it is |
| Same product, margin by customer | Inconsistent concessions |
| Margin vs. order size | The fulfilment cost cliff on small orders |
| Realised vs. list price, over time | Discount drift, price-cost lag |
A category average can represent very different transaction distributions. An 8% category margin, for example, could be a tight cluster around 8% or a mixture of high- and low-margin volume. The distribution helps show whether a specific tail or segment warrants investigation.
From finding to fixing
Quantify each leak as annualised value, then sort by value × ease:
- Policy changes — discount approval thresholds, minimum order values, freight recovery rules. Fast, no system change, immediate effect.
- Process changes — cost-change-to-price-change cycle time, rebate accrual review cadence. Slower, larger.
- Model-driven — predicting which quotes need a concession and how much, rather than applying a blanket rate.
Start with changes whose value and implementation cost can be measured. That establishes whether the diagnostic survives operational review before anyone is asked to change a system.
Sources and further reading
These references support the technical concepts discussed above. Examples and recommendations in the article remain editorial interpretation.